> ## Documentation Index
> Fetch the complete documentation index at: https://docs.verify-group.com/llms.txt
> Use this file to discover all available pages before exploring further.
# Dashboard
> Understand your Verify Group home screen — what each metric means, how to read your verification activity, and how to navigate to any part of the platform.
## Overview
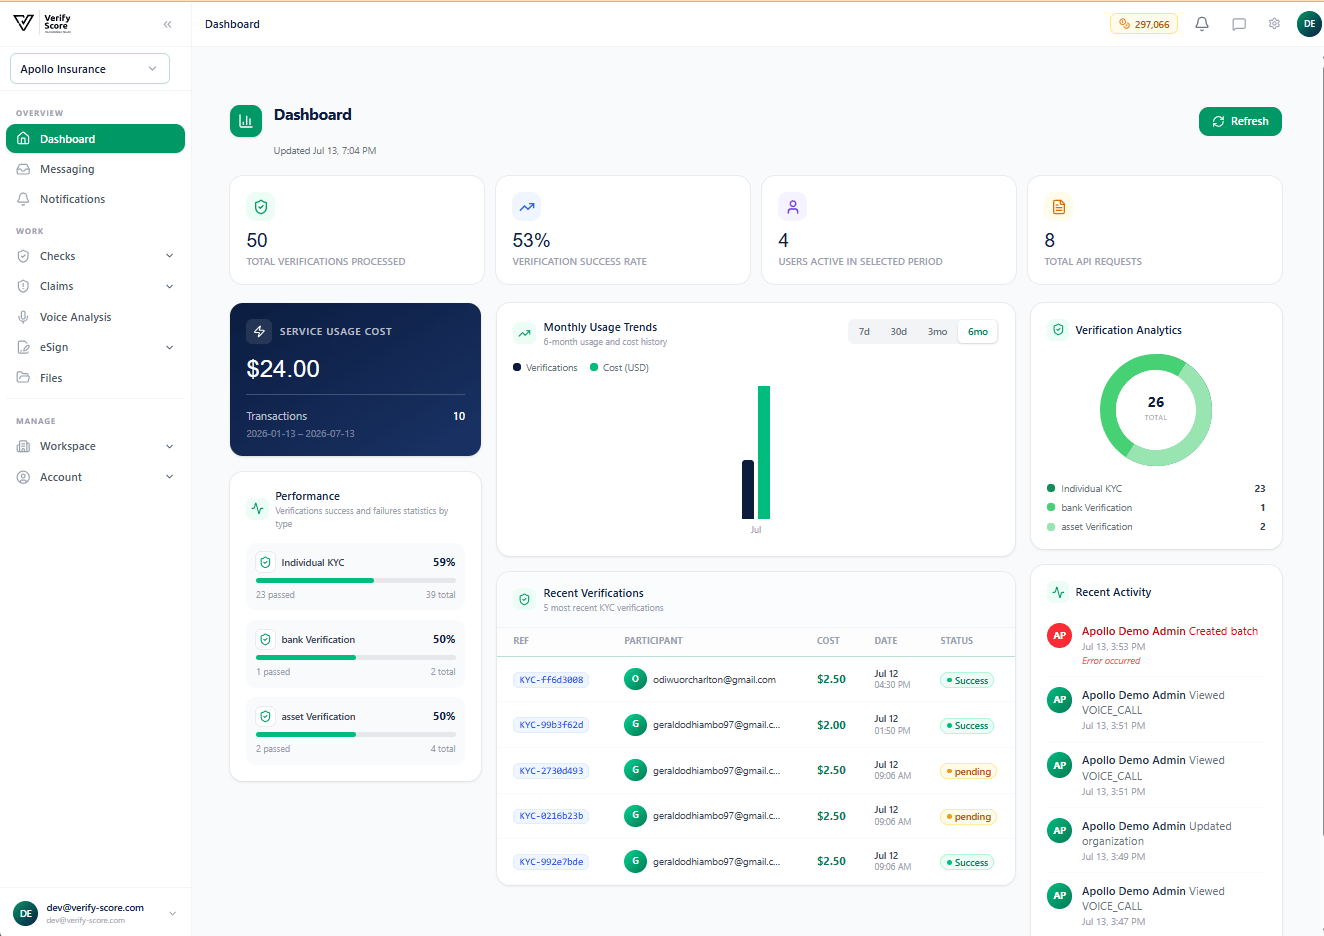
The **Dashboard** is the first screen you see after logging in. It gives you a real-time summary of your organisation's activity: how many identity checks have been completed, your token balance, recent activity by your team, and platform-wide performance trends.
Think of the Dashboard as your **mission control** — everything you need to know about what is happening right now is visible here without having to click into individual records.
 ***
## Understanding the Dashboard layout
The Dashboard is divided into four main areas:
| Area | What it shows |
| --------------------------------- | -------------------------------------------------------------------------------- |
| **Top navigation bar** | Organisation selector, notifications bell, messaging icon, and your profile menu |
| **Left sidebar** | Navigation to every section of the platform |
| **Metric cards (top row)** | Summary counts for key platform activities |
| **Charts and tables (main area)** | Detailed breakdowns, trends, and recent transactions |
***
## The metric cards
Along the top of the main content area you will see four summary cards. These update in real time as your team performs verifications and actions.
### KYC Verifications
The total number of identity verification requests processed by your organisation across all time (or the date range you have selected). A higher number reflects greater usage of the platform's identity services.
### Verification Success Rate
The percentage of KYC verifications that concluded with a positive result — meaning the person was confirmed as who they said they were. A healthy rate for most organisations is above **85%**. If your rate drops significantly, it may indicate that participant data submitted to verifications needs to be more accurate.
### Active Users
The number of team members in your organisation who have logged in and performed at least one action during the selected time period.
### Total Claims
The number of insurance claims that exist in your organisation's claims workspace. This includes claims at all stages — from newly submitted to settled.
***
## The sidebar navigation
The left-hand sidebar is your primary way to move around the platform. It is divided into sections:
**Overview**
* **Dashboard** — returns you to this home screen
* **Messaging** — your team inbox for internal conversations
* **Notifications** — alerts about verifications, claims, and system events
**Work**
* **Checks** — run identity verifications on individuals and businesses
* **Claims** — manage the full insurance claims lifecycle
* **Voice Analysis** — review recorded interviews and fraud analysis
* **eSign** — send and track DocuSign envelopes
* **Files** — manage uploaded documents and evidence
**Manage**
* **Workspace** — organisation settings, team members, and roles
* **Account** — your personal profile and preferences
The sidebar can be collapsed by clicking the **arrow icon** at the top right of the sidebar panel. This gives you more screen space when working with large tables or detailed views. Your collapsed preference is saved automatically.
***
## Usage trends chart
The bar chart in the middle of the Dashboard shows your **monthly verification activity** and the associated **service cost** over the past several months.
* **Dark blue bars** represent the number of verifications performed
* **Green bars** represent the cost in USD for those verifications
You can filter by time period using the buttons in the top-right of the chart: **7d** (7 days), **30d** (30 days), **3mo** (3 months), or **6mo** (6 months).
Use the **6-month view** to spot seasonal trends in your verification volume — for example, higher activity during new-customer onboarding periods.
***
## Service usage cost card
The dark card on the left of the main area shows your **total platform spend** for the selected period. Below the total, you can see the number of individual transactions that contributed to this cost.
This gives your finance team a quick view of platform expenditure without needing to access billing reports directly.
***
## Performance breakdown
Below the cost card, the **Performance** panel shows your verification success rates broken down by verification type — for example, individual identity checks, business KYB, document authenticity, and so on.
Each row shows:
* The verification type name
* A progress bar showing the success rate
* The number of successful verifications vs. the total attempted
***
## Recent verifications table
The table on the right side of the centre column shows the **5 most recent KYC verifications** performed by anyone in your organisation. Each row shows:
| Column | Meaning |
| --------------- | ------------------------------------------------------ |
| **Ref** | A short reference ID for this verification request |
| **Participant** | The email address of the person being verified |
| **Cost** | The token cost charged for this verification |
| **Date** | When the verification was submitted |
| **Status** | Whether the verification passed, is pending, or failed |
Click any row to open the full verification record.
***
## Recent activity feed
The panel on the far right shows a live feed of **recent actions** by your team — who ran a verification, who created a claim, who approved a document, and when. This is useful for audit purposes and for keeping track of what your team has been doing without reviewing individual records.
***
## Powered by CreditInfo
Verify Group's identity verification is powered by **CreditInfo**, one of Africa's leading credit and identity data providers. Their data coverage across Kenya, Uganda, Tanzania, and other East African markets ensures that your verifications draw on accurate, up-to-date records.
***
## Next steps
Verify a person using the Individual KYC workflow.
Open a new insurance claim and begin the investigation workflow.
***
## Understanding the Dashboard layout
The Dashboard is divided into four main areas:
| Area | What it shows |
| --------------------------------- | -------------------------------------------------------------------------------- |
| **Top navigation bar** | Organisation selector, notifications bell, messaging icon, and your profile menu |
| **Left sidebar** | Navigation to every section of the platform |
| **Metric cards (top row)** | Summary counts for key platform activities |
| **Charts and tables (main area)** | Detailed breakdowns, trends, and recent transactions |
***
## The metric cards
Along the top of the main content area you will see four summary cards. These update in real time as your team performs verifications and actions.
### KYC Verifications
The total number of identity verification requests processed by your organisation across all time (or the date range you have selected). A higher number reflects greater usage of the platform's identity services.
### Verification Success Rate
The percentage of KYC verifications that concluded with a positive result — meaning the person was confirmed as who they said they were. A healthy rate for most organisations is above **85%**. If your rate drops significantly, it may indicate that participant data submitted to verifications needs to be more accurate.
### Active Users
The number of team members in your organisation who have logged in and performed at least one action during the selected time period.
### Total Claims
The number of insurance claims that exist in your organisation's claims workspace. This includes claims at all stages — from newly submitted to settled.
***
## The sidebar navigation
The left-hand sidebar is your primary way to move around the platform. It is divided into sections:
**Overview**
* **Dashboard** — returns you to this home screen
* **Messaging** — your team inbox for internal conversations
* **Notifications** — alerts about verifications, claims, and system events
**Work**
* **Checks** — run identity verifications on individuals and businesses
* **Claims** — manage the full insurance claims lifecycle
* **Voice Analysis** — review recorded interviews and fraud analysis
* **eSign** — send and track DocuSign envelopes
* **Files** — manage uploaded documents and evidence
**Manage**
* **Workspace** — organisation settings, team members, and roles
* **Account** — your personal profile and preferences
The sidebar can be collapsed by clicking the **arrow icon** at the top right of the sidebar panel. This gives you more screen space when working with large tables or detailed views. Your collapsed preference is saved automatically.
***
## Usage trends chart
The bar chart in the middle of the Dashboard shows your **monthly verification activity** and the associated **service cost** over the past several months.
* **Dark blue bars** represent the number of verifications performed
* **Green bars** represent the cost in USD for those verifications
You can filter by time period using the buttons in the top-right of the chart: **7d** (7 days), **30d** (30 days), **3mo** (3 months), or **6mo** (6 months).
Use the **6-month view** to spot seasonal trends in your verification volume — for example, higher activity during new-customer onboarding periods.
***
## Service usage cost card
The dark card on the left of the main area shows your **total platform spend** for the selected period. Below the total, you can see the number of individual transactions that contributed to this cost.
This gives your finance team a quick view of platform expenditure without needing to access billing reports directly.
***
## Performance breakdown
Below the cost card, the **Performance** panel shows your verification success rates broken down by verification type — for example, individual identity checks, business KYB, document authenticity, and so on.
Each row shows:
* The verification type name
* A progress bar showing the success rate
* The number of successful verifications vs. the total attempted
***
## Recent verifications table
The table on the right side of the centre column shows the **5 most recent KYC verifications** performed by anyone in your organisation. Each row shows:
| Column | Meaning |
| --------------- | ------------------------------------------------------ |
| **Ref** | A short reference ID for this verification request |
| **Participant** | The email address of the person being verified |
| **Cost** | The token cost charged for this verification |
| **Date** | When the verification was submitted |
| **Status** | Whether the verification passed, is pending, or failed |
Click any row to open the full verification record.
***
## Recent activity feed
The panel on the far right shows a live feed of **recent actions** by your team — who ran a verification, who created a claim, who approved a document, and when. This is useful for audit purposes and for keeping track of what your team has been doing without reviewing individual records.
***
## Powered by CreditInfo
Verify Group's identity verification is powered by **CreditInfo**, one of Africa's leading credit and identity data providers. Their data coverage across Kenya, Uganda, Tanzania, and other East African markets ensures that your verifications draw on accurate, up-to-date records.
***
## Next steps
Verify a person using the Individual KYC workflow.
Open a new insurance claim and begin the investigation workflow.