

Overview
The Dashboard is the first screen you see after logging in. It gives you a real-time summary of your organisation’s activity: how many identity checks have been completed, your token balance, recent activity by your team, and platform-wide performance trends. Think of the Dashboard as your mission control — everything you need to know about what is happening right now is visible here without having to click into individual records.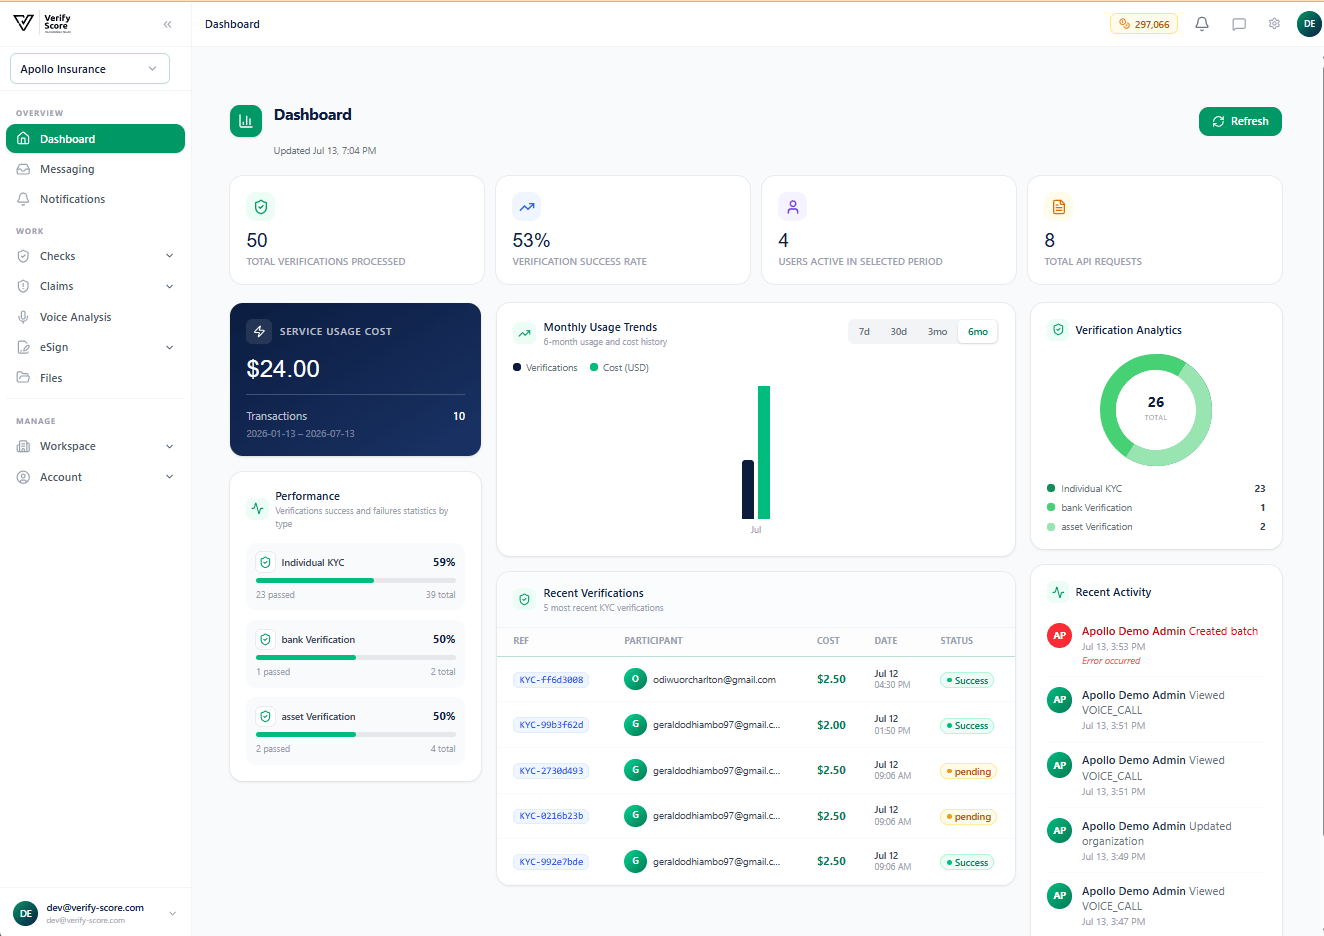
Understanding the Dashboard layout
The Dashboard is divided into four main areas:The metric cards
Along the top of the main content area you will see four summary cards. These update in real time as your team performs verifications and actions.KYC Verifications
The total number of identity verification requests processed by your organisation across all time (or the date range you have selected). A higher number reflects greater usage of the platform’s identity services.Verification Success Rate
The percentage of KYC verifications that concluded with a positive result — meaning the person was confirmed as who they said they were. A healthy rate for most organisations is above 85%. If your rate drops significantly, it may indicate that participant data submitted to verifications needs to be more accurate.Active Users
The number of team members in your organisation who have logged in and performed at least one action during the selected time period.Total Claims
The number of insurance claims that exist in your organisation’s claims workspace. This includes claims at all stages — from newly submitted to settled.The sidebar navigation
The left-hand sidebar is your primary way to move around the platform. It is divided into sections: Overview- Dashboard — returns you to this home screen
- Messaging — your team inbox for internal conversations
- Notifications — alerts about verifications, claims, and system events
- Checks — run identity verifications on individuals and businesses
- Claims — manage the full insurance claims lifecycle
- Voice Analysis — review recorded interviews and fraud analysis
- eSign — send and track DocuSign envelopes
- Files — manage uploaded documents and evidence
- Workspace — organisation settings, team members, and roles
- Account — your personal profile and preferences
Usage trends chart
The bar chart in the middle of the Dashboard shows your monthly verification activity and the associated service cost over the past several months.- Dark blue bars represent the number of verifications performed
- Green bars represent the cost in USD for those verifications
Service usage cost card
The dark card on the left of the main area shows your total platform spend for the selected period. Below the total, you can see the number of individual transactions that contributed to this cost. This gives your finance team a quick view of platform expenditure without needing to access billing reports directly.Performance breakdown
Below the cost card, the Performance panel shows your verification success rates broken down by verification type — for example, individual identity checks, business KYB, document authenticity, and so on. Each row shows:- The verification type name
- A progress bar showing the success rate
- The number of successful verifications vs. the total attempted
Recent verifications table
The table on the right side of the centre column shows the 5 most recent KYC verifications performed by anyone in your organisation. Each row shows:
Click any row to open the full verification record.
Recent activity feed
The panel on the far right shows a live feed of recent actions by your team — who ran a verification, who created a claim, who approved a document, and when. This is useful for audit purposes and for keeping track of what your team has been doing without reviewing individual records.Powered by CreditInfo
Verify Group’s identity verification is powered by CreditInfo, one of Africa’s leading credit and identity data providers. Their data coverage across Kenya, Uganda, Tanzania, and other East African markets ensures that your verifications draw on accurate, up-to-date records.Next steps
Run an identity check
Verify a person using the Individual KYC workflow.
Create a claim
Open a new insurance claim and begin the investigation workflow.